
Higher Order Linear Regression
- Roma Fatima
- Nov 11, 2021
- 2 min read

This blog helps us understand the concept of overfitting using the Higher Order Linear Regression.
Concept of Overfitting and Underfitting:
Suppose we have a sample dataset such as below:
Our expected output for that dataset will be:

In simple words, overfitting is the concept used to describe the model which is trained with lots of data and impacts the performance of the model negatively. What causes overfitting is high model complexity and limited training size.
In linear regression overfitting occurs when the model is "too complex". This usually happens when there are a large number of parameters compared to the number of observations. Such a model will not generalize well to new data. That is, it will perform well on training data, but poorly on test data.
The above dataset will have overfitting as:

Similarly, underfitting is the concept used to describe the model which is trained with minimal data and impacts the performance of the model negatively. What causes underfitting is over simplification.
In linear regression underfitting occurs when the model is too "simple". This usually happens when there is lesser parameters than the observations. Such a model will not generalize well to new data and have unreliable predictions. That is, it will perform poorly on training data as well as on test data.
The above dataset will have underfitting as:

My Contribution:
We begin the program by loading packages of numpy as np, pandas as pd and matplotlib.pyplot as plt. They are used for linear algebra, data processing and plotting graphs, respectively.

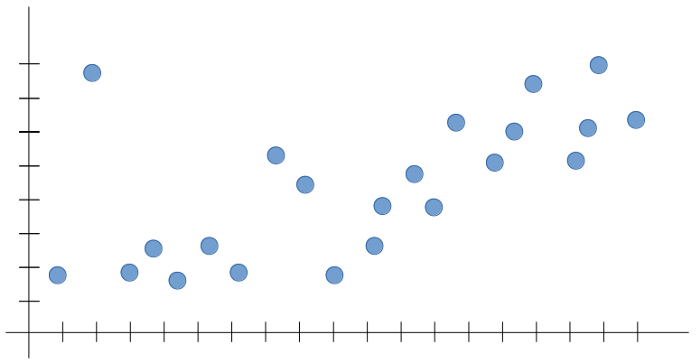
We generate 20 data pairs (X, Y) using y = sin(2*pi*X) + 0.1 * N. Where we take N from the normal gaussian distribution, as np.random.normal(0,1).

Output:

Now we train and test 10 data pairs each and plot it's graph. Blue points are train data pairs and Red points are test data pairs in the graph.

Output:

Now we implement polynomial regression for orders 0, 1, 3, 9.

Experiments:
I got the below referenced code with sklearn which could have made the program easier. I experimented with altering this code but unfortunately I was not able to implement weight updating in this format.

Challenges Faced:
One of the challenges I faced was in graphing part of the program. I was unable to plot line graphs because of this unknown error in plotting.

To overcome this challenge I plotted the graph in points format as below.

References:
Explanation of overfitting concept: https://datascience.stackexchange.com/questions/80868/overfitting-in-linear-regression
Explanation of overfitting and underfitting concepts from slides of CSE 5334 Data Mining course at UTA: https://uta.instructure.com/courses/88045/files/15438532?module_item_id=3762690
Images of overfitting and underfitting concepts: https://towardsdatascience.com/what-are-overfitting-and-underfitting-in-machine-learning-a96b30864690
Code reference: https://towardsdatascience.com/polynomial-regression-gradient-descent-from-scratch-279db2936fe9
Code with scikit-learn in challenges faced: https://towardsdatascience.com/gradient-descent-from-scratch-e8b75fa986cc


Comments