
Titanic Survival
- Roma Fatima
- Sep 28, 2021
- 2 min read

The Kaggle competition "Titanic - Machine Learning Disaster" is where we analyze the passenger data and predict who will survive the disaster and who will not.
We are provided with 2 files:
train.csv - Here we have the passenger details that we use for training dataset. It has the following information of 891 passengers.
PassengerId
Survived ( 1 - Survived, 0 - Died )
Pclass ( 1 - First Class, 2 - Second Class, 3 - Third Class)
Name
Sex ( Male, Female )
Age
SibSp ( Siblings and Spouse )
Parch ( Parents and Children)
Ticket
Fare
Cabin
Embarked ( S, C, Q )
test.csv - Here we have subset of data for testing with 418 passengers in the list. We use the train.csv to find patterns and see which passengers survived. This file contains all the columns as above except for the column of 'Survived'.
We begin the program by loading packages of numpy as np and pandas as pd. They are used for linear algebra and data processing, respectively.


The above code shows us the file locations. Output:

Now we load the train dataset through the command of read_csv from the file location.

The command of head( ) displays the first 5 rows of the table in our train.csv file.
Output:

The next step is to load the test dataset through the same procedure of read_csv.

Again we display the first 5 rows of the table of our test.csv file through the head( ) function.
Output:

For our first attempt at prediction, we assume that all the women passengers onboard survived and all the men passengers died.

The code above calculates the percentage of female passengers who survived.
Output:

We also calculate the percentage of male passengers who survived.
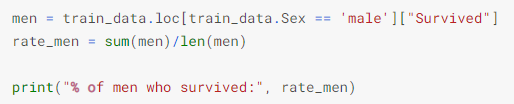
Output:

We can see that nearly 75% of the women and only 19% of the men onboard survived. Gender is a great element for predicting the survival, but it cannot be the only element taken into consideration. We have 10 more columns provided in train.csv.
We will create a model that uses RandomForestClassifier from the sklearn python package. Here we will consider each passenger's data and predict if that person survived or not. This prediction is made based on patterns found in train.cvs file for passengers in test.cvs file.
We will consider 4 columns i.e., passenger class (Pclass), sex, siblings and spouse onboard (SibSp) and parents and children onboard (Parch).

The predictions made by the code are saved in a new file called submission.csv.
Output:

Reference for the explanation of the blog: https://www.kaggle.com/alexisbcook/titanic-tutorial
Reference for the image of the blog: https://www.nationalgeographic.org/thisday/apr15/titanic-sinks/


Comments